I have historical historical data that looks as following:
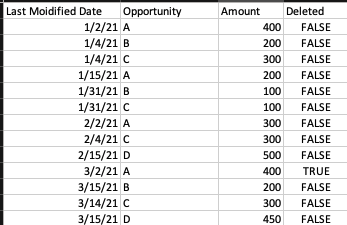
I need to get a DB VIEW of how each of these Opportunities looked like at the end of the month e.g.
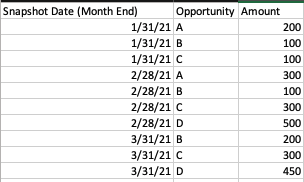
What is the best way to implement this in Matillion?
I have historical historical data that looks as following:
I need to get a DB VIEW of how each of these Opportunities looked like at the end of the month e.g.
What is the best way to implement this in Matillion?
Hello,
I would say, some window-function magic would do the trick.
Since your problem is just basicly find a partition, sort it and pick the row from that partition that matches your requirements.
1) Create the other part of the Partition, LAST_DAY('Last Modified Date') as "MonthEndDate"
2) Identifty the 'final' row of that partition, ROW_NUMBER() OVER ( PARTITION BY "Opportunity", "MonthEndDate" Order By "Last Modified Date" DESC ) as "RN_Last"
3) View the result, SELECT "MonthEndDate", "Opportunity", "Amount" FROM "Data" Where "RN_Last" = 1
This is one way of solving it, hope it helps :)
Br,
Michael
Hi @MichaelBoucht . Thanks for the response. I was thinking more along the lines of using the Matillion components to build this view. I could potentially use SQL and create a VIEW in Snowflake, but I was wondering if I could use native Matillion Transformation components for this. Thanks.
Hey, I suppose all the stuff I mentioned would be possible with 3 transformation components, 1 Calculator, 2 Rank, 3 Filter.
But if you are looking for something more straight forward for that specific requirement, I'm not sure that is in there yet :)
-Michael